|
|
||
| Home | Products | Downloads | Order | Support | Applications | Forum | Testimonials | Company | Contact Us | ||
|
|
||
| Multi-Instrument - DDC (Derived Data Curve) | ||||||||||||
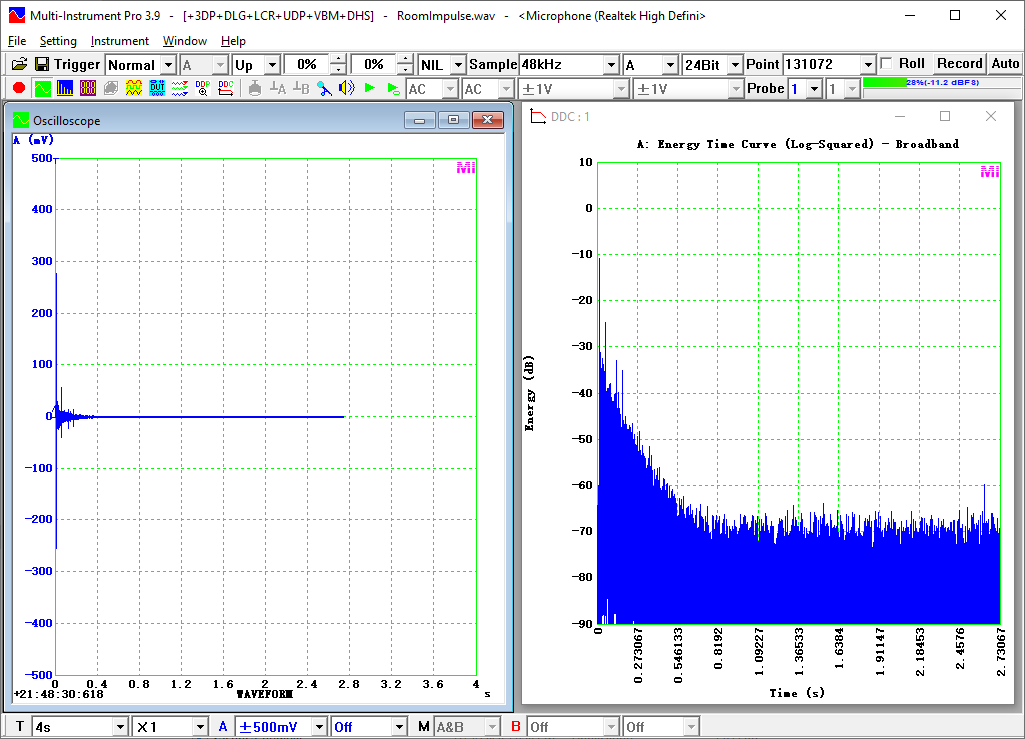
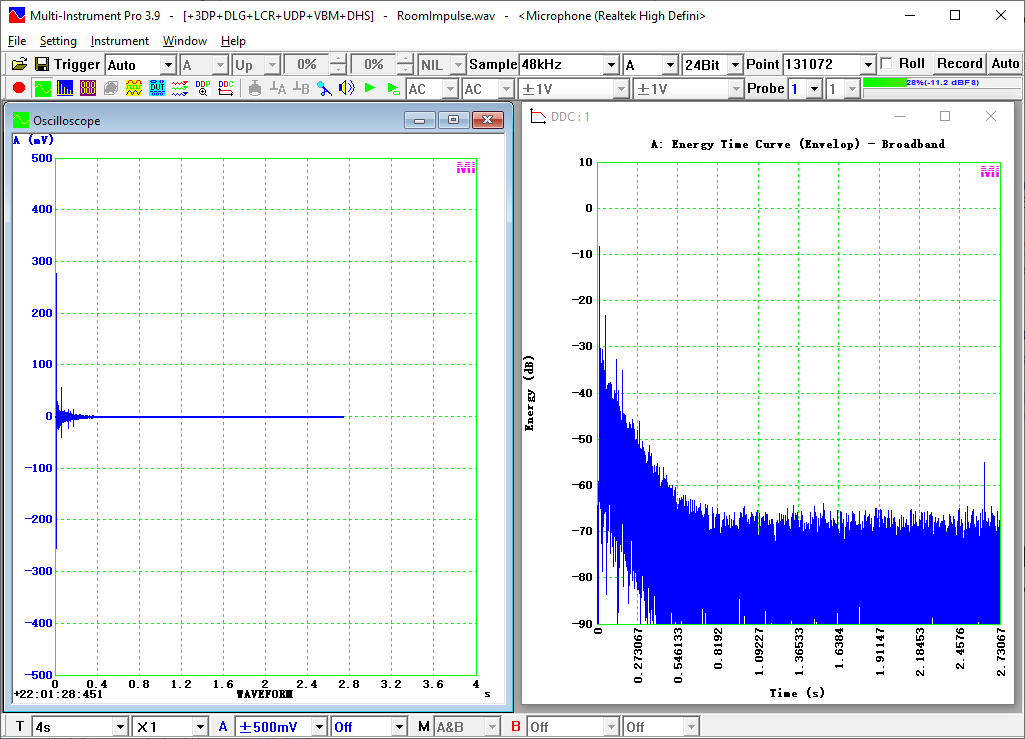
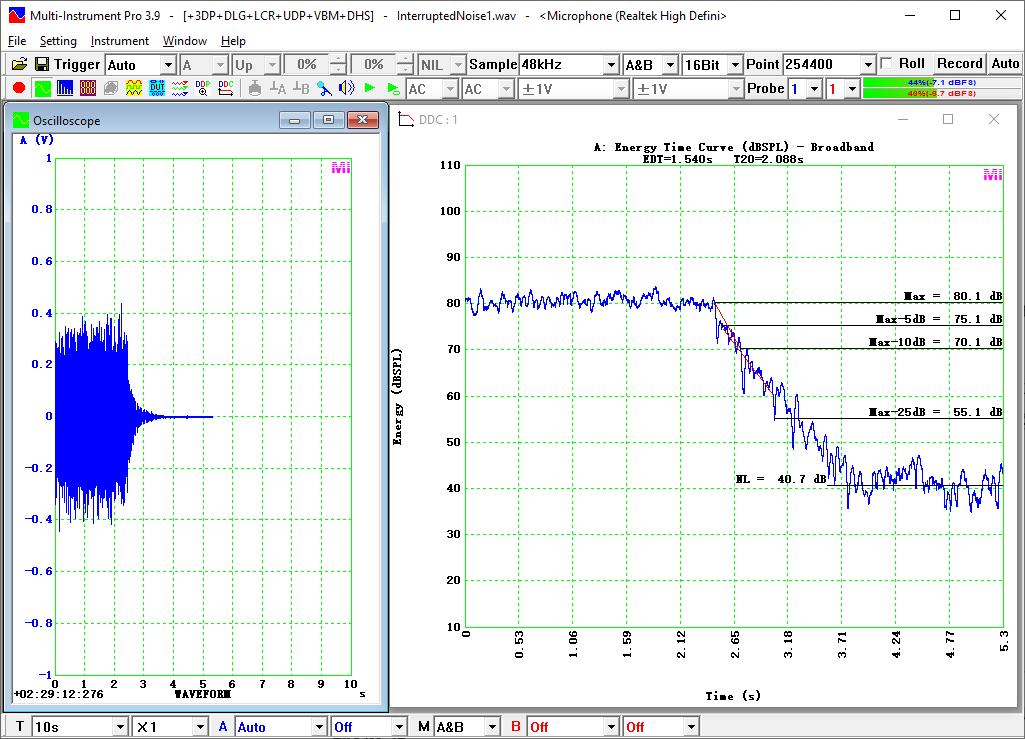
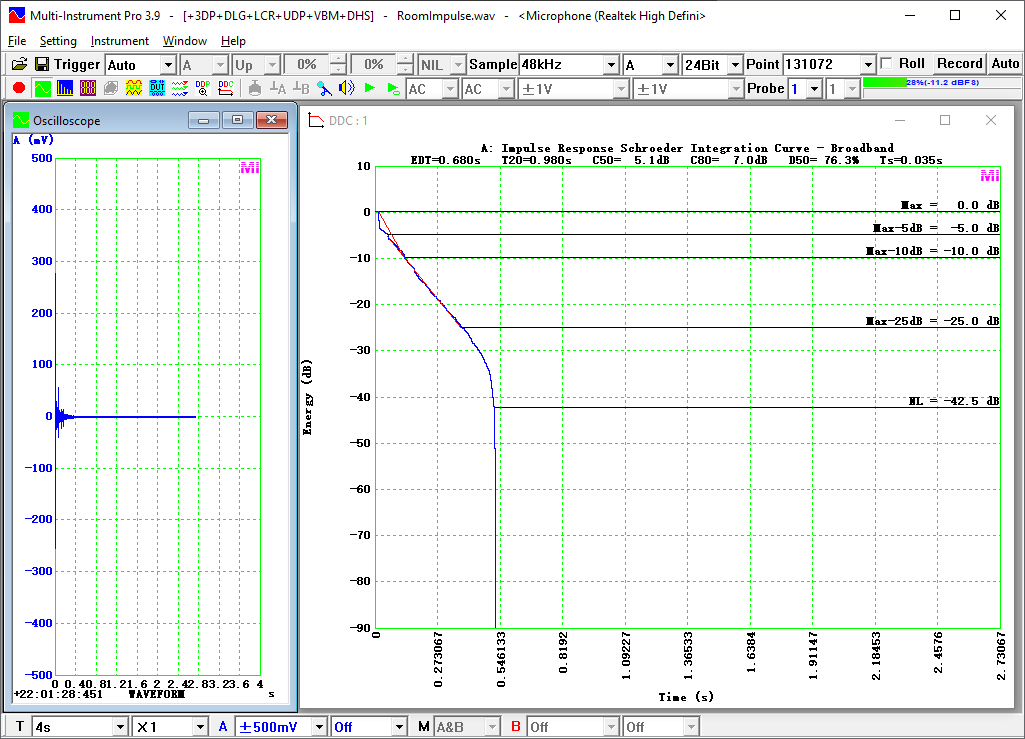
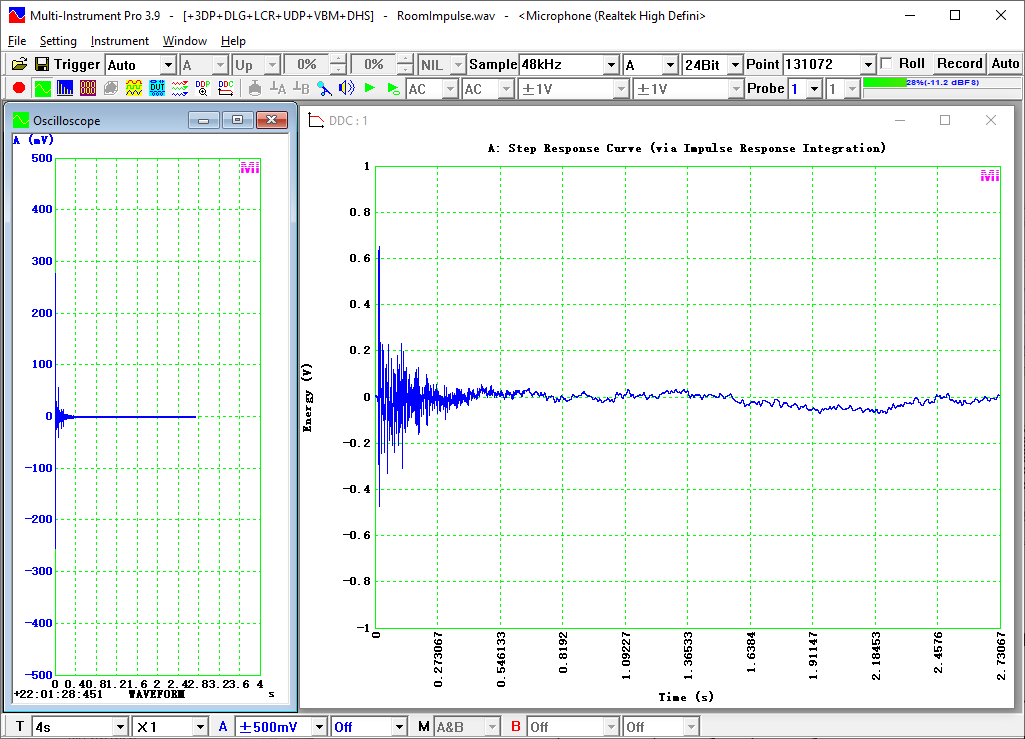
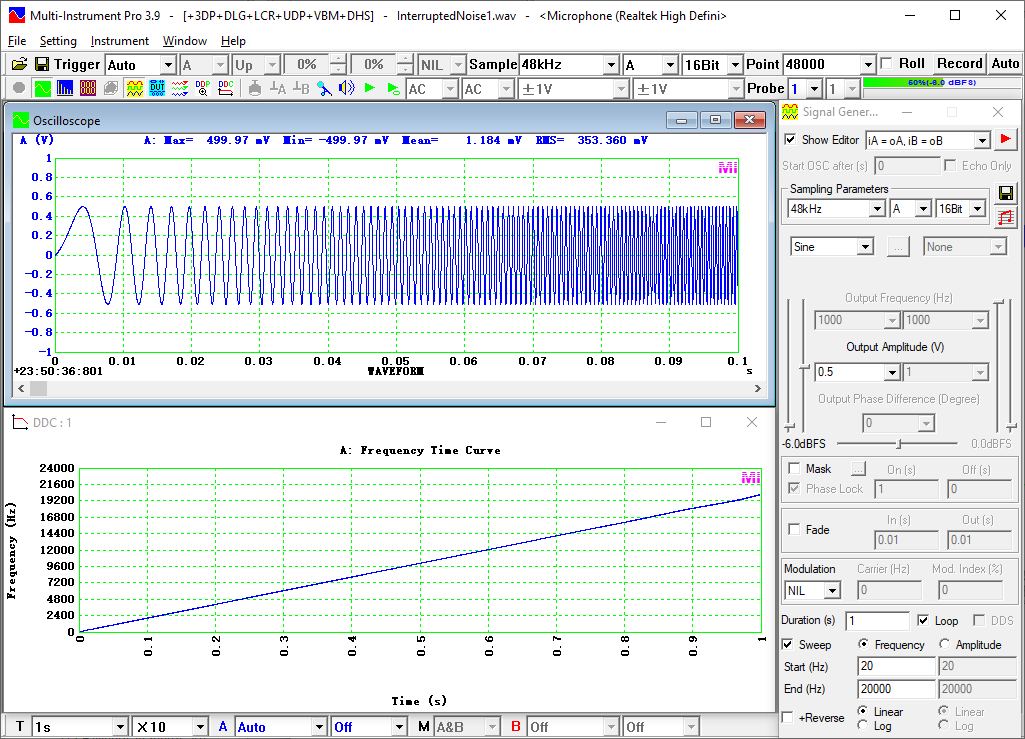
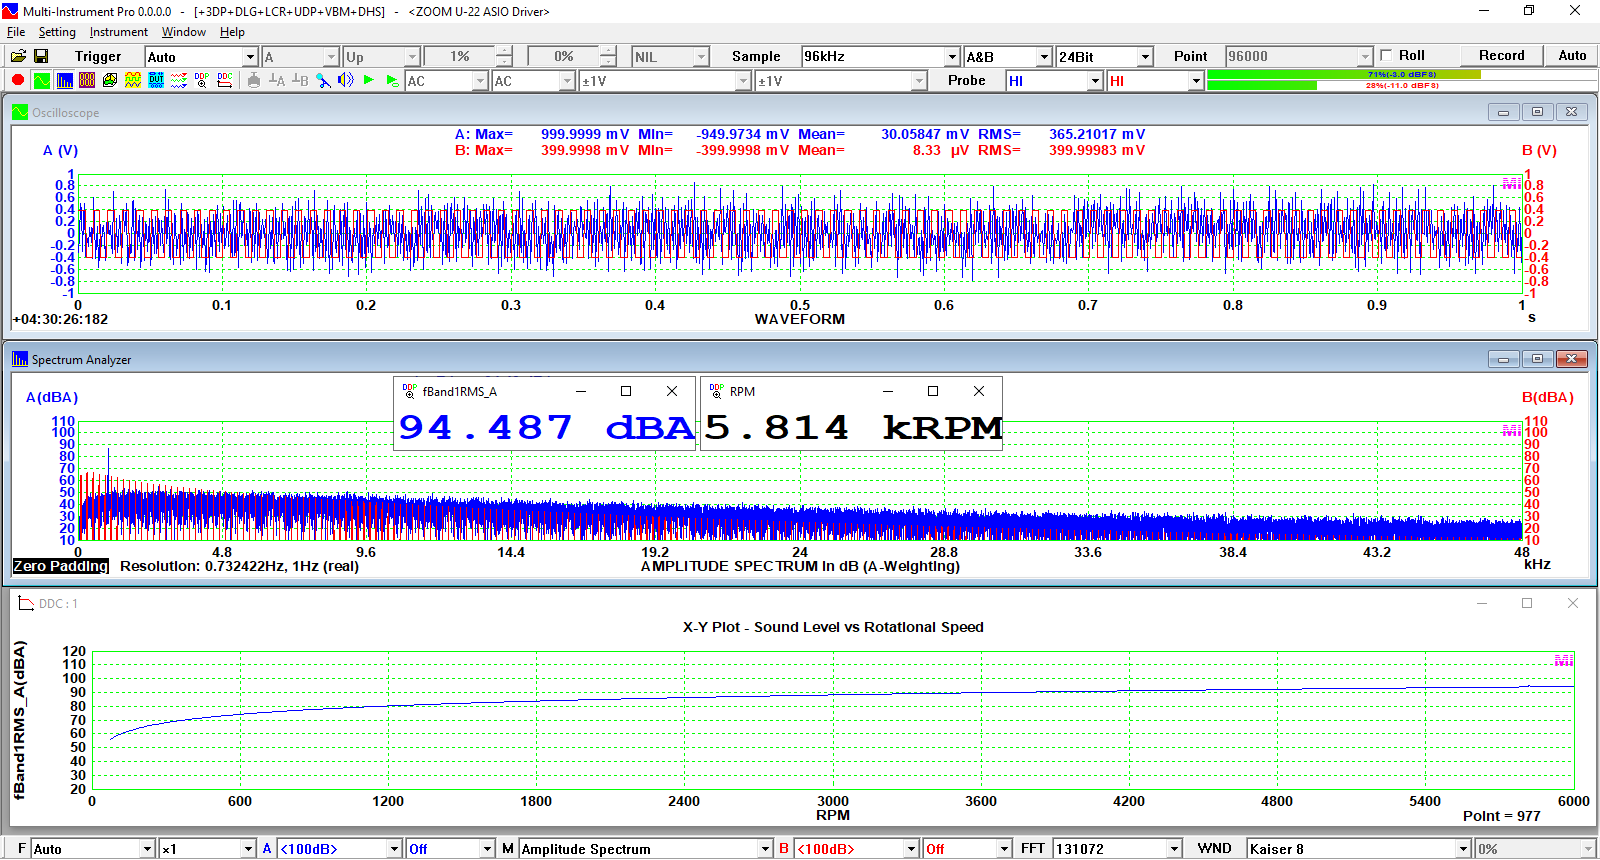
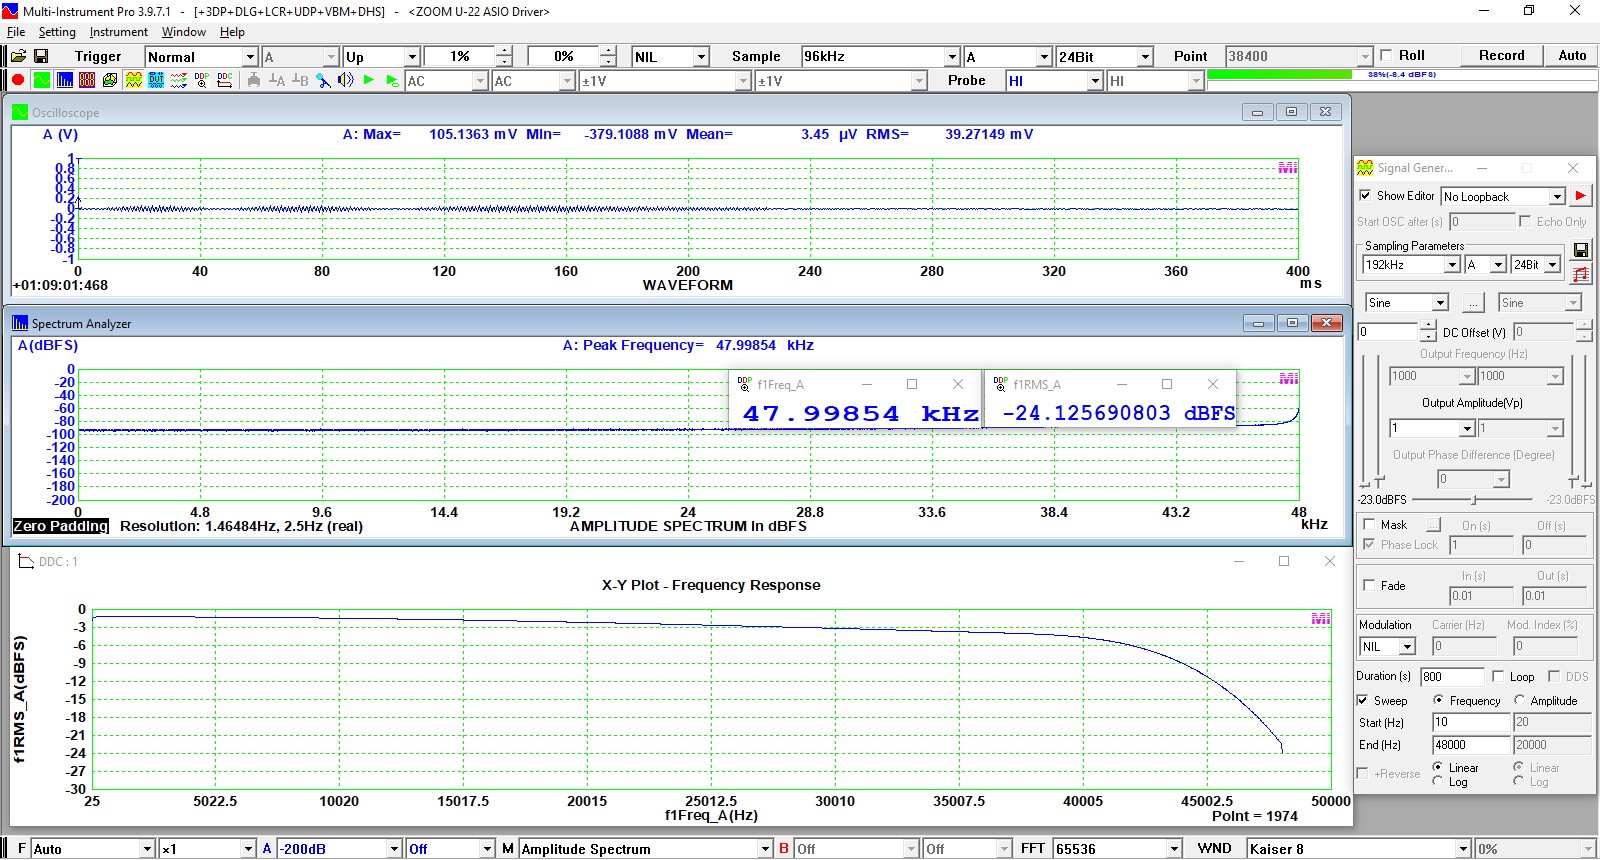
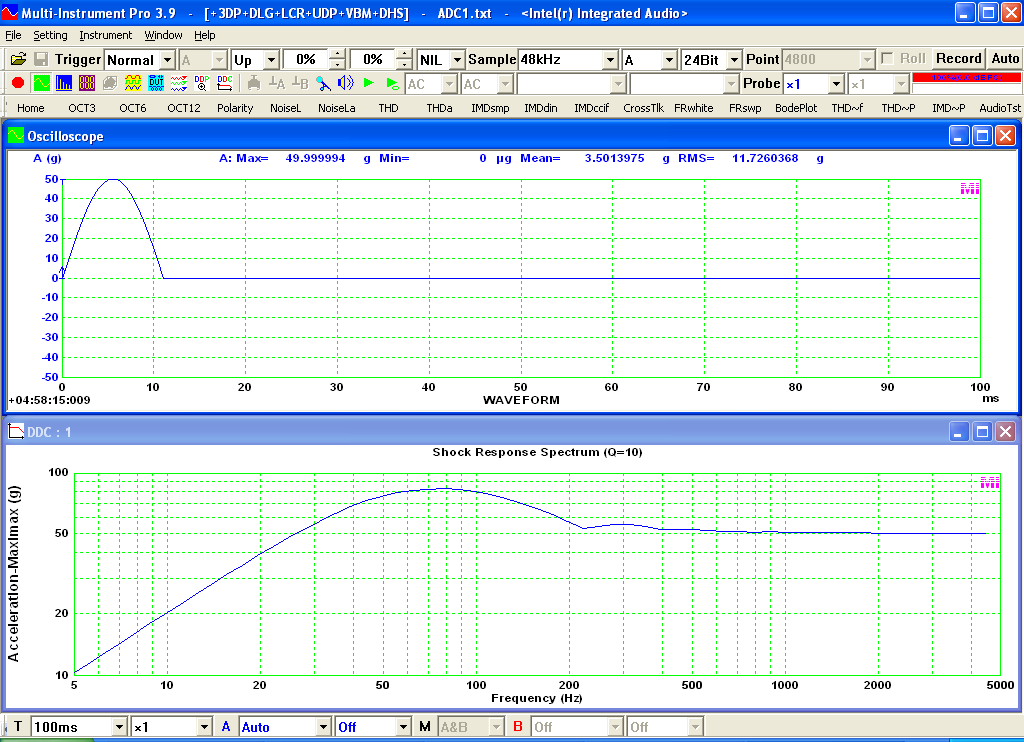
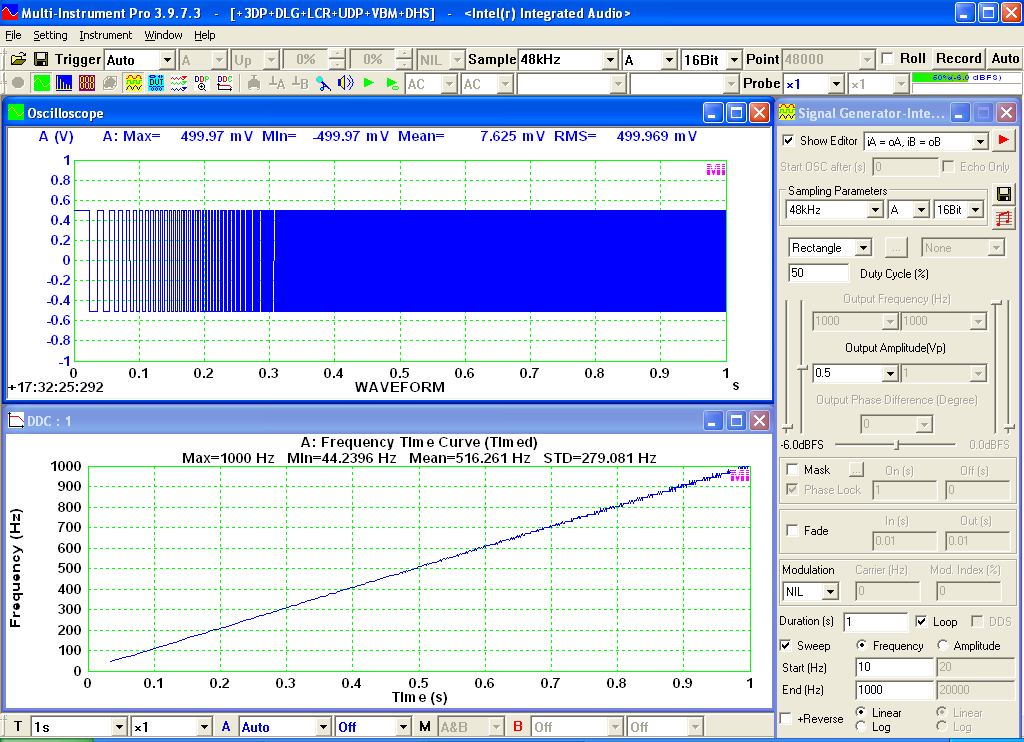
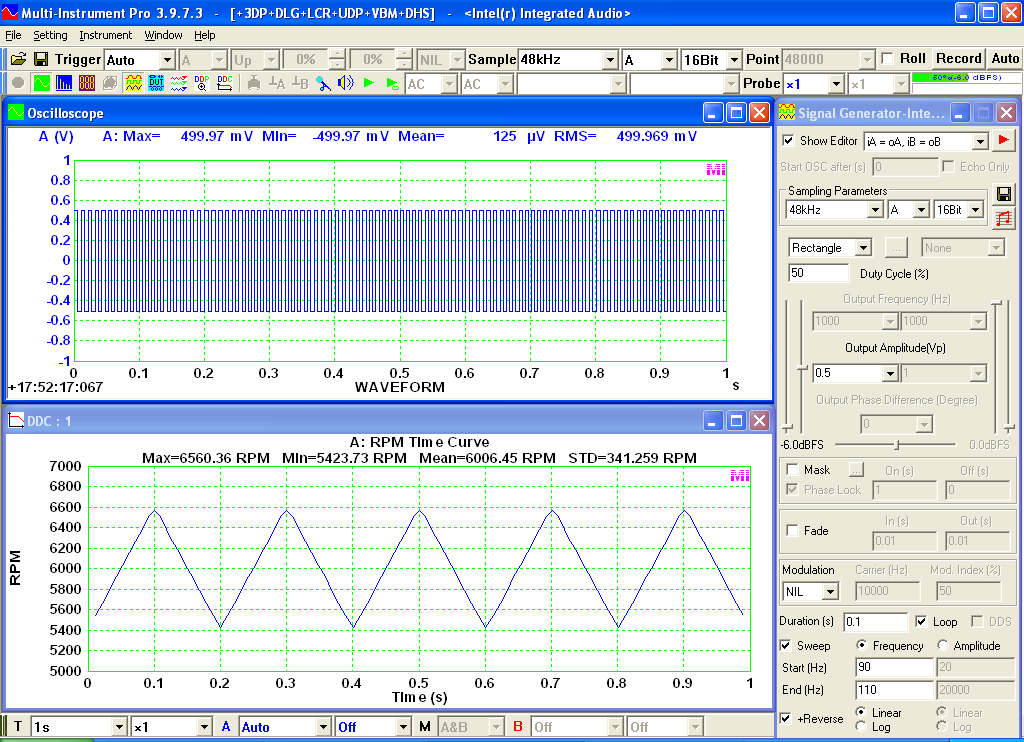
 Specifications 1. Derive a dedicated data curve from a frame of sampled data and display it in a standalone graph window. Maximum 8 DDC windows can be opened. 2. The DDC window is similar to the X-Y Plot in Device Test Plan except that its context menu contains a [DDC Processing] menu item which is used to select a predefined DDC and configure its relevant parameters. The supported DDCs are: (1) Energy Time Curve (Log-Squared) (2) Energy Time Curve (Envelope) (3) Energy Time Curve (dBSPL) (4) Impulse Response Schroeder Integration Curve (5) Step Response Curve (via Impulse Response Integration) (6) Frequency Time Curve (Demodulated) (7) X-Y Plot (8) Shock Response Spectrum (9) Frequency Time Curve (Timed) (10) RPM Time Curve 3. Supports Multilingual User Interface under Windows 2000, XP, Vista, 7, 8, 8.1, 10, 11 and above. Currently supported languages are English, French, German, Italian, Portuguese, Spanish, Russian, Simplified Chinese, Traditional Chinese, Japanese and Korean. Examples:
|
| Home | Products | Downloads | Order | Support | Applications | Forum | Testimonials | Company | Contact Us |
|