Specifications
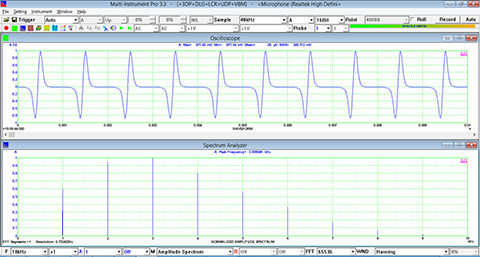
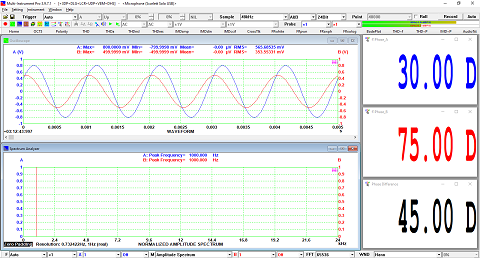
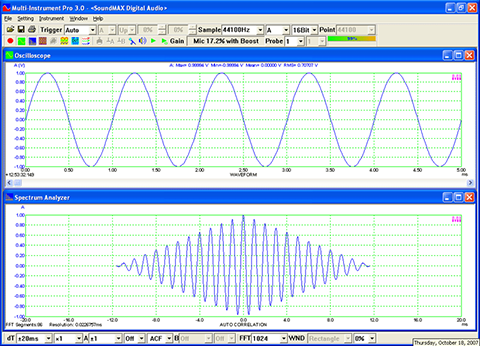
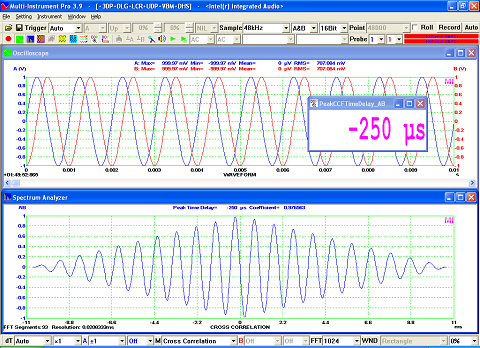
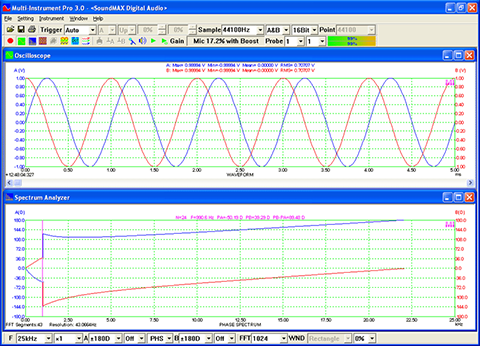
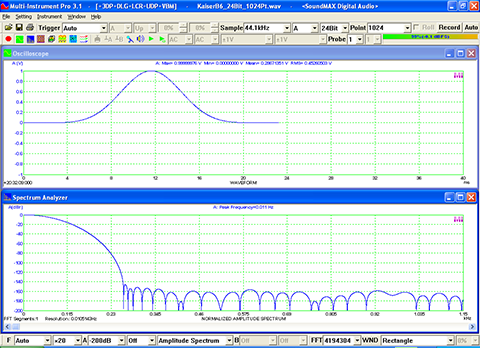
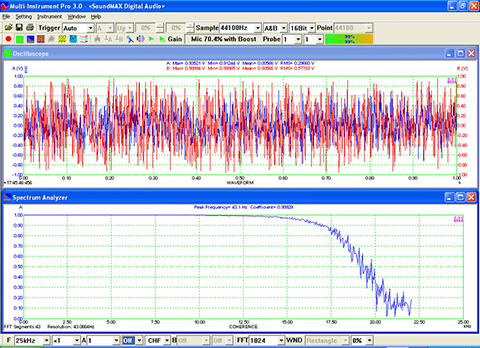
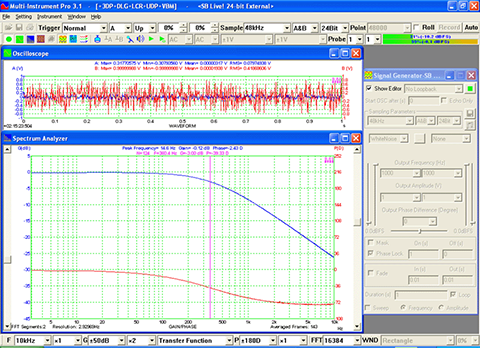
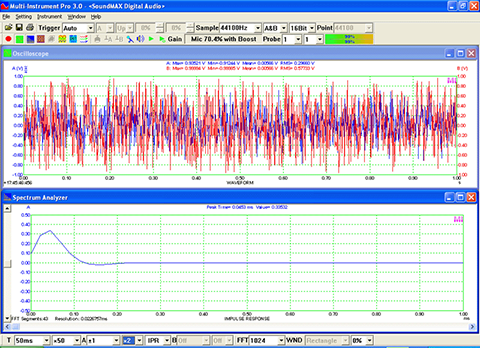
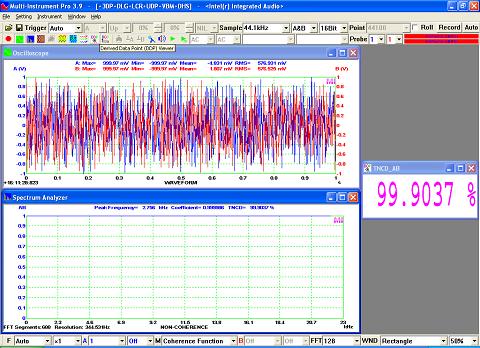
- Seven view types: Real time Amplitude Spectrum, Real time Phase Spectrum, Real time Auto Correlation Function, Real time Cross Correlation Function, Real time Coherence / Non-Coherence Function, Real time Transfer Function / Impedance Analyzer, Real time Impulse Response.
- Independent X axis and Y axis zooming and scrolling.
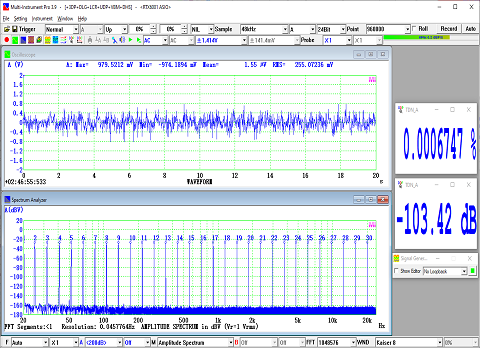
- In Amplitude Spectrum, Y axis supports relative modes in linear and dBr scale, and absolute mode in RMS voltage, dBV, dBu, dB, dBFS scale. X axis supports linear, logarithmic and octave scale (1/1, 1/3, 1/6, 1/12, 1/24, 1/48, 1/96). Support amplitude / power spectrum density display. Y axis can be converted to impedance display.
- Analysis results can be exported as TXT files.
- Data curve can be print-previewed, printed out directly or saved as BMP files.
- Fast display refresh rate: about 50 frames per second (tested with a sound card under Windows XP SP2 on IBM ThinkPad R51 Laptop PC with Intel Pentium M processor 1.60 GHz, with scan time=10 ms and FFT size=1024 and both the Oscilloscope and the Spectrum Analyzer running under "Auto" mode). Thus data are displayed and analyzed in "true" real time.
- The colors of display, font size, screen refresh rate are configurable.
- FFT size can be adjusted from 128 to 4194304 points.
- Allow record length to be different from FFT size. If the FFT size is greater than the record length, then zero(s) will be added at the end of the actual measurement data during FFT computation. If the FFT size is less than the record length, then the measurement data will be split into different segments with the size of each segment equal to the FFT size. Segment overlap percentage can be selected in the range of 0%~99.9%. The final result will be obtained by averaging the FFT results from all segments.
- Support 69 window functions: Rectangle, Triangle (or Fejer), Hann, Hamming, Blackman, Exact Blackman, Blackman Harris, Blackman Nuttall, Flat Top, Exponential, Gaussian, Welch (or Riesz), Cosine, Riemann (or Lanczos), Parzen, Tukey, Bohman, Poisson, Hann-Poisson, Cauchy, Bartlett-Hann, Kaiser, etc.
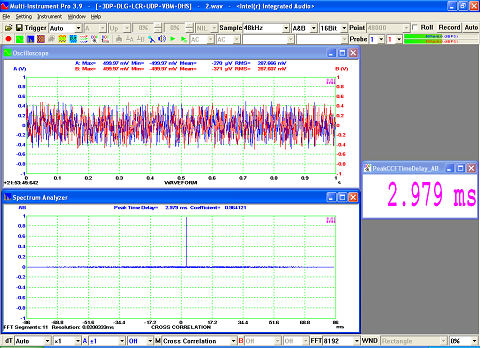
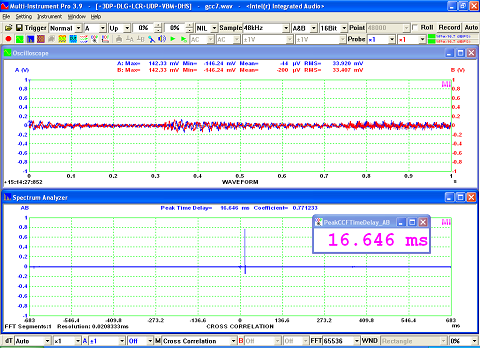
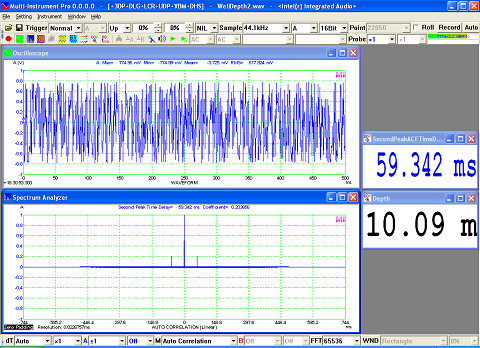
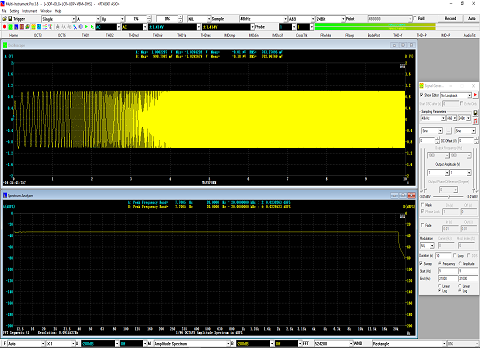
- Display peak frequency with sub-FFT-bin-size accuracy in Amplitude Spectrum display, second peak time delay and corresponding coefficient in Auto Correlation Function display, peak time delay and corresponding coefficient in Cross Correlation Function display, peak frequency and corresponding coefficient in Coherence Function display, peak frequency and corresponding gain and phase in Transfer Function display, peak time and corresponding value in Impulse Response display.
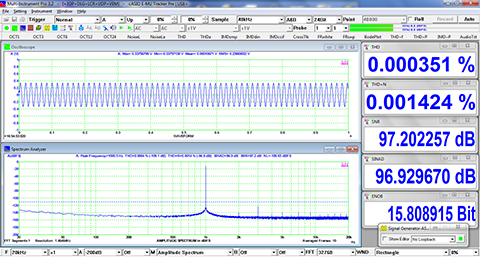
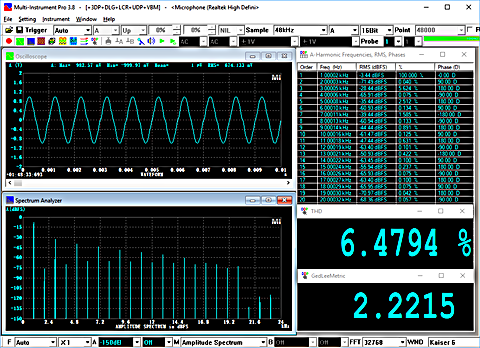
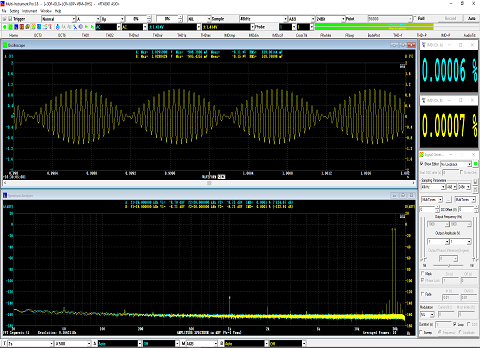
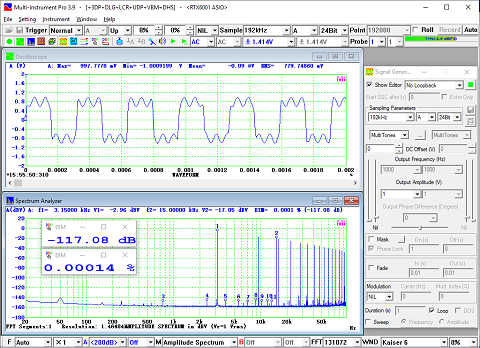
- Allow the measurement of Total Harmonic Distortion (THD), THD+Noise (THD+N), Signal in Noise and Distortion (SINAD), Signal-to-Noise Ratio (SNR) and Noise Level (NL), Total Non-Coherent Distortion+Noise (TNCD), and GedLee Metric in a specified frequency range.
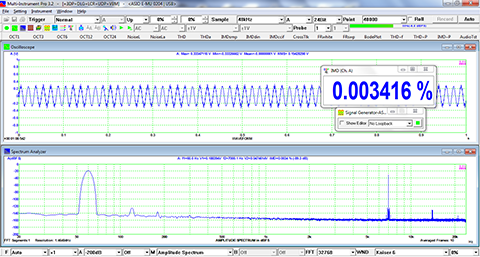
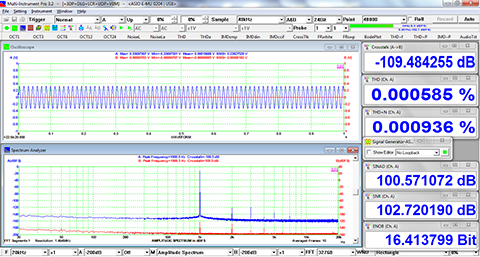
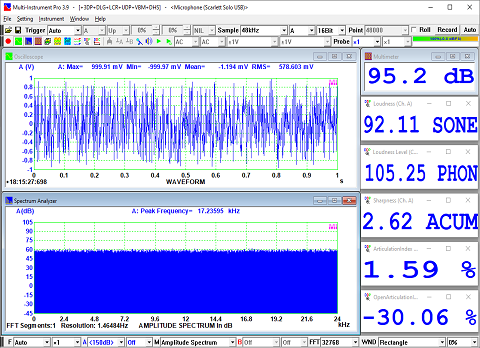
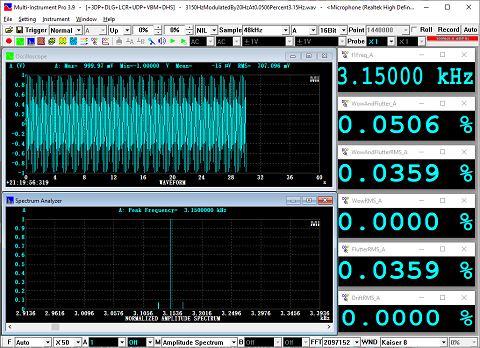
- Allow the measurement of IMD-SMPTE/DIN, IMD-CCIF2, IMD-CCIF3, DIM, Crosstalk, Bandwidth (-3dB), Harmonics, Energy in user defined frequency bands, Peaks, Total Distortion+Noise (TD+N), Wow & Flutter, sound loudness, loudness level & sharpness & articulation index.
- In THD measurement and harmonics analysis, the fundamental frequency can be detected automatically based on the peak frequency or another variable such as the RPM reading from a tachometer (e.g. for the purpose of order tracking). It can also be specified manually.
- Support one cursor reader and two markers which stick to the measurement data. Support peak markers.
- Intra-frame processing includes: Remove DC Component, Frequency Compensation, Frequency Weighting (flat, A weighting, B weighting , C weighting, ITU-R 468 weighting), and Smooth via Moving Average (linear or octave). Frequency compensation is achieved via loading a user configurable text-based Frequency Compensation File (*.fcf).
- Four inter-frame processing methods: None, Peak Hold, Linear Average, Exponential Average. The number of frames (2~200, forever) for peak hold or linear averaging can be specified. The process can be reset during runtime if “forever” is chosen.
- Five chart types: Line, Scatter, Column, Bar, and Step. Line width is adjustable.
- Up to five reference curves can be set for each channel. The reference curve can be configured by either copying the current curve, or loading a properly formatted text file or a previously saved reference file from the hard disk. Reference curves can be assigned as High-High, High, Low, Low-Low limits.
- The data in the graph can be copied into the clipboard as text and later paste into other software such as Microsoft Excel for further analysis. The image of the graph can be copied into the clipboard as Bitmap image and later paste into other software such as Microsoft Word.
- Supports Multilingual User Interface under Windows 2000, XP, Vista, 7, 8, 8.1, 10, 11 and above. Currently supported languages are English, French, German, Italian, Portuguese, Spanish, Russian, Simplified Chinese, Traditional Chinese, Japanese and Korean.
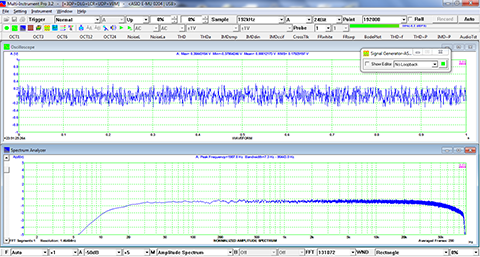
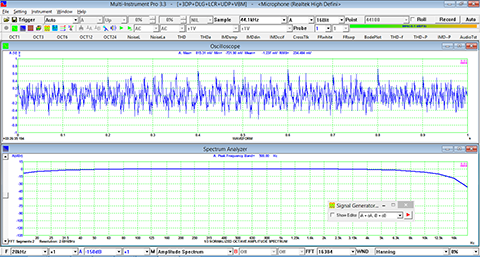
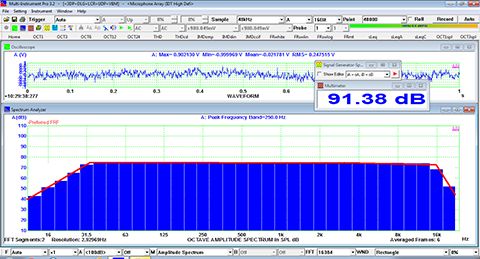
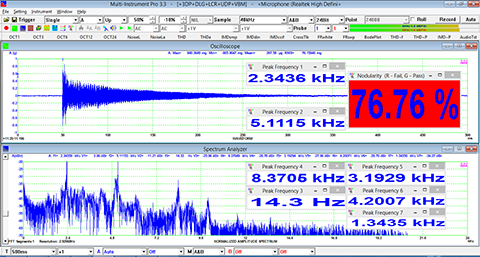
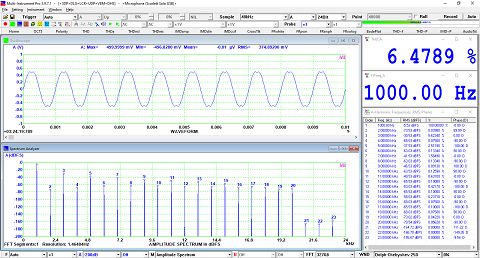
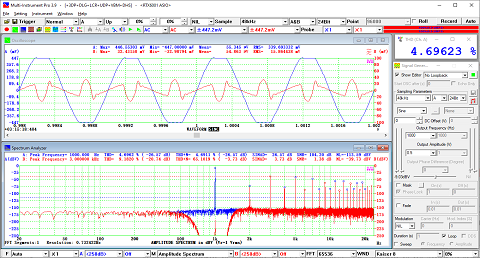
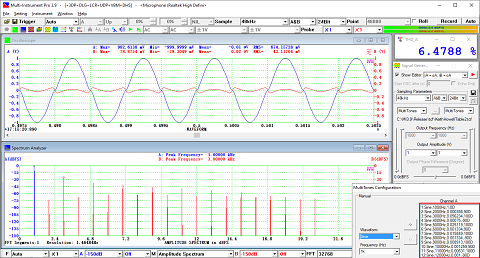
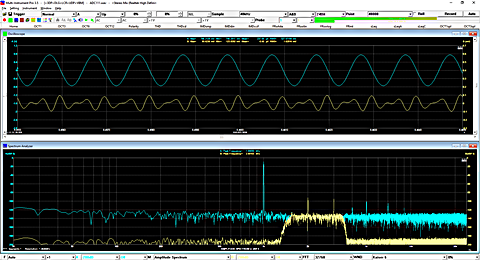
Examples
×
![]()