Specifications
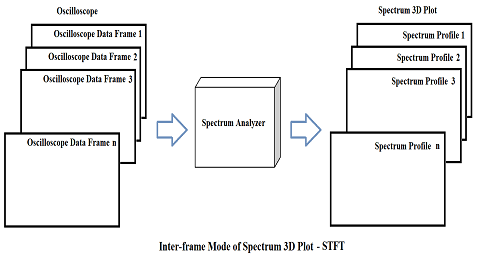
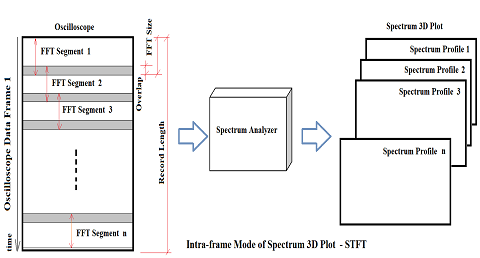
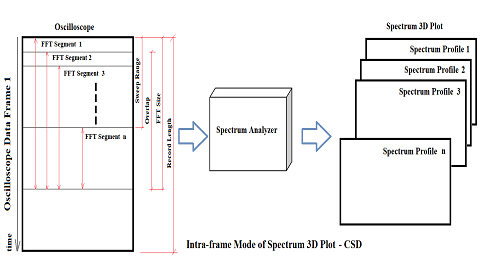
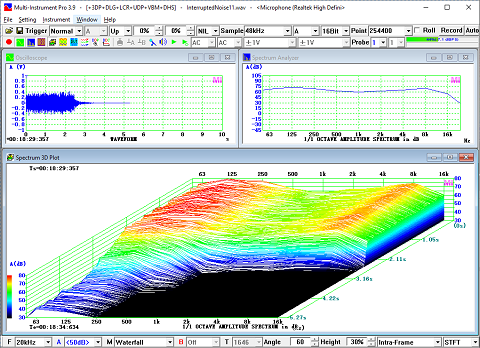
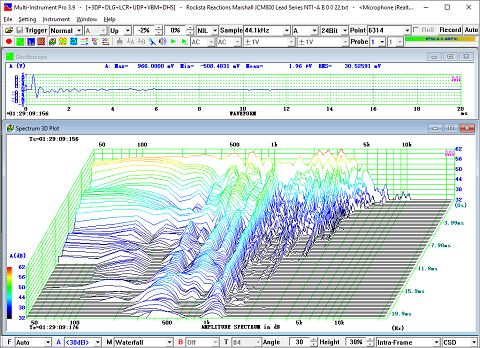
- Support Waterfall Plot and Spectrogram. It can be generated by multiple frames of data (Inter-frame Mode) or one single frame of data (Intra-frame mode). The former supports Short Time Fourier Transform (STFT) only while the latter supports both STFT and Cumulative Spectral Decay (CSD).
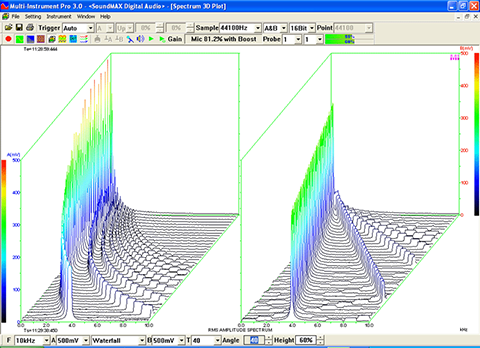
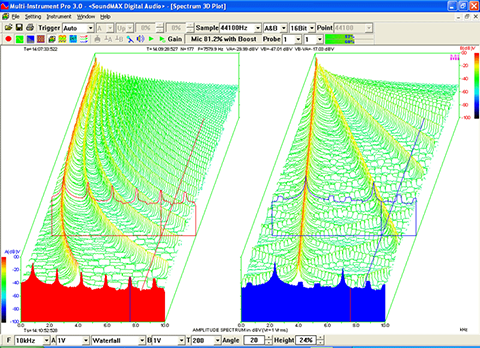
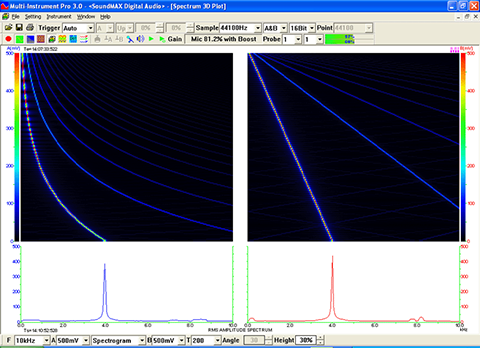
- For Waterfall Plot, the tilt angle of T axis and the height percentage of Y axis are adjustable. Six color palettes are available: No Color, Rainbow, Bluish, Yellowish, Grayscale, Inverted Grayscale.
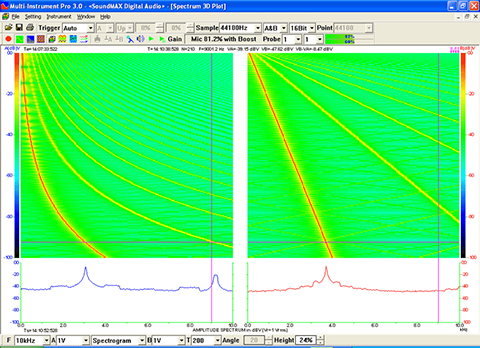
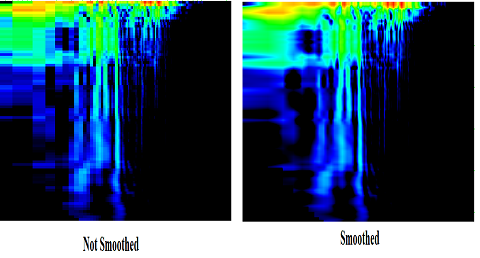
- For Spectrogram, five color palettes are available: Rainbow, Bluish, Yellowish, Grayscale, Inverted Grayscale. A smoothing option is provided.
- X axis can be displayed in linear, logarithmic, or 1/1 ~ 1/96 octave scale.
- Y axis is displayed in absolute mode in RMS Voltage, dBV, dBu, dBSPL or dBFS.
- Number of spectral profiles can be set from 10 to 200.
- Spectral profiles are time stamped with an accuracy in 1 ms.
- A 3D cursor reader can be used to display the X, Y, T readings of an actual measurement point. The X-Y profile at that point is highlighted and also displayed in a separate X-Y plot.
- The data in the graph can be copied into the clipboard as text and later paste into other software such as Microsoft Excel for further analysis. The image of the graph can be copied into the clipboard as Bitmap image and later paste into other software such as Microsoft Word.
- Analysis results can be exported as TXT files. The 3D data can be sliced by either time or frequency.
- Data curves can be print-previewed, printed out directly or saved as BMP files.
- Independent X axis and Y axis zooming.
- Supports Multilingual User Interface under Windows 2000, XP, Vista, 7, 8, 8.1, 10, 11 and above. Currently supported languages are English, French, German, Italian, Portuguese, Spanish, Russian, Simplified Chinese, Traditional Chinese, Japanese and Korean.
Examples
×
![]()