Specifications
-
ADC Hardware Related Specifications
Sound Card based systems:
- Scan Time: 100 µs~500 s (computer memory dependent).
- Bandwidth: 10 Hz - 200 kHz (sound card dependent).
- Maximum Allowable Input Voltage (if connected directly): about 3 V (sound card dependent).
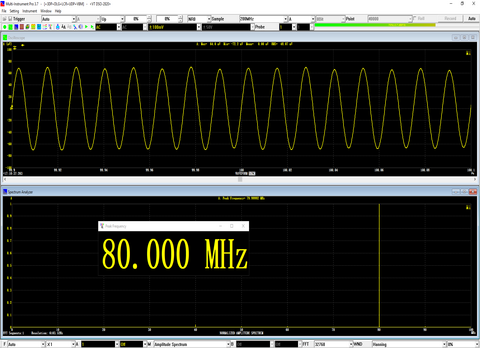
- Selectable sampling frequency (up to 768 kHz), sampling bit resolution (8, 16 24 or 32 bits) and sampling channels (one or two) (sound card dependent)
- Four trigger modes: Auto, Normal, Single and Slow.
- Support triggering by rising edge, falling edge, or both at a specified trigger level or for a specified amount of change, in the selected input channel. Support trigger frequency rejection.
- Support pre-triggering and post triggering from 0 to 100% of the specified record length.
- Continuously monitor the input signal such that no trigger event is missed before data collection
- Support calibration of the input channels with the input gain setting automatically being taken into account. Re-calibration is not necessary even if the gain setting changes.
Non Sound Card based systems:
Please refer to the respective hardware manual.
- Can be used as a transient signal recorder to capture and store raw data continuously into a sequence of WAV files in the hard disk.
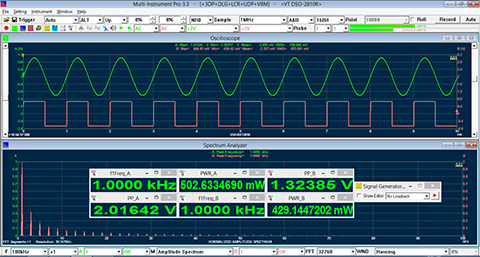
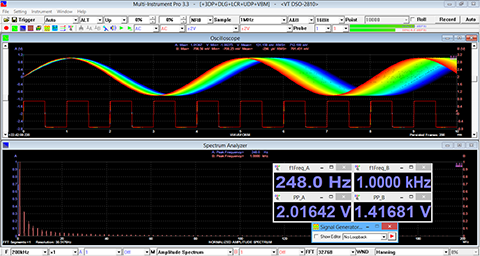
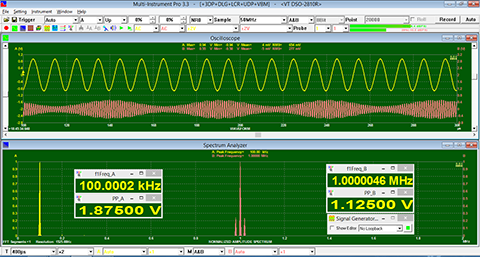
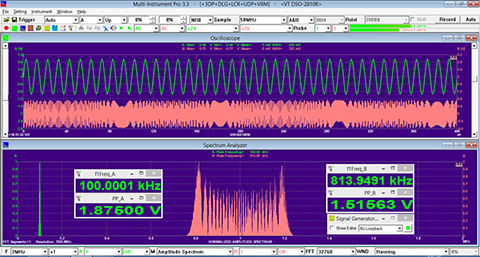
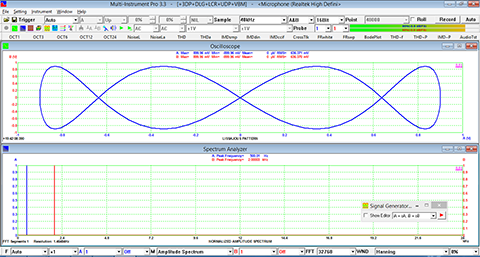
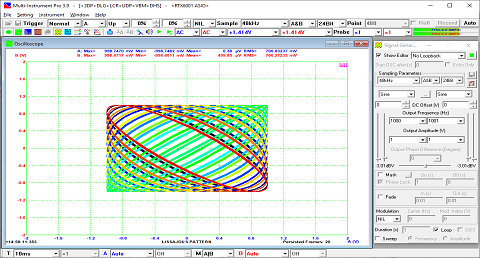
- Five view types: Real time waveform of Channel A and Channel B, Real time waveform of Channel A + Channel B, Real time waveform of Channel A - Channel B, Real time waveform of Channel A x Channel B, Real time Lissajous Pattern for Channel A and Channel B.
- Independent X axis and Y axis zooming and scrolling.
- WAV files and properly formatted TXT files can be imported for display and analysis.
- Collected measurement data can be saved as WAV files or exported as TXT files.
- Data curve can be print-previewed, printed out directly or saved as BMP files.
- Support adding notes to the measurement data.
- Fast display refresh rate: about 50 frames per second (tested with a sound card under Windows XP SP2 on IBM ThinkPad R51 Laptop PC with Intel Pentium M processor 1.60 GHz, with scan time=10 ms and FFT size=1024 and both the Oscilloscope and the Spectrum Analyzer running under "Auto" trigger mode). Thus data are displayed and analyzed in "true" real time.
- The colors of display, font size, screen refresh rate are configurable.
- Number of points (samples) to be collected per sweep can be fine tuned at one point's resolution.
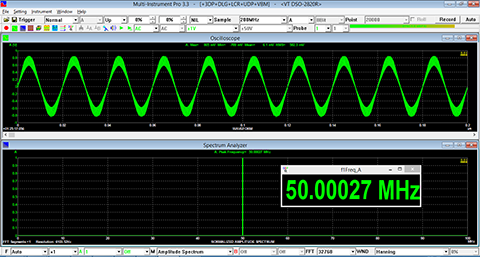
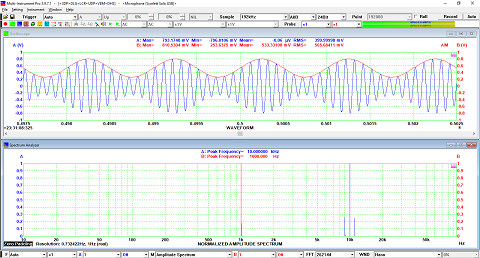
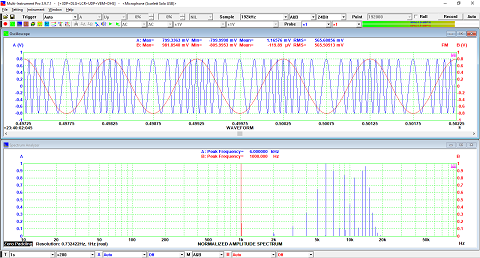
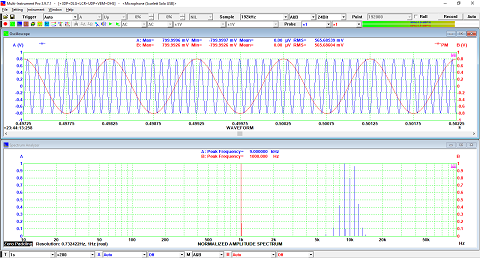
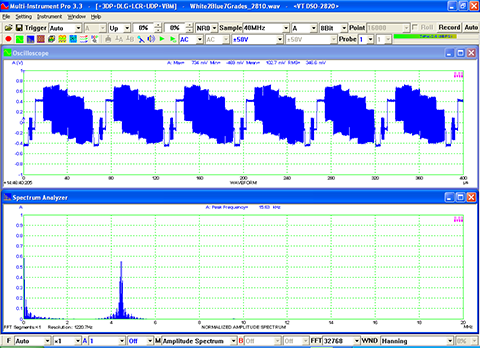
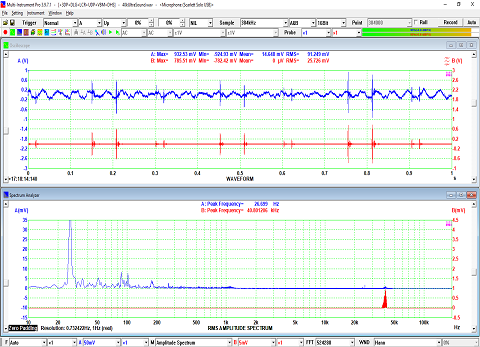
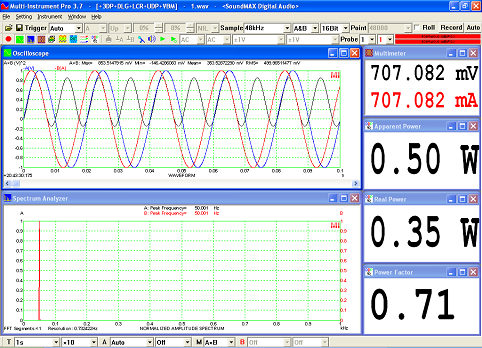
- Display the Maximum, Minimum, Mean, RMS values of the data per sweep. Therefore it can be used as a voltmeter.
- Support one cursor reader and two markers which stick to the measurement data.
- Five chart types: Line, Scatter, Column, Bar, and Step. Line width is adjustable. Support SINC interpolation between samples.
- Support combining data from individual channels of different wave files and extracting part of data from a wave file.
- Support normal and inverted display of a waveform.
- Up to five reference curves can be set for each channel. The reference curve can be configured by either copying the current curve, or loading a properly formatted text file or a previously saved reference file from the hard disk. Reference curves can be assigned as High-High, High, Low, Low-Low limits.
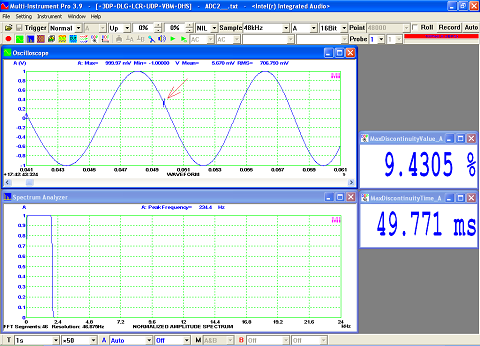
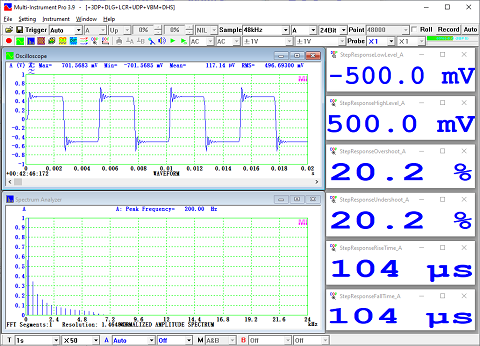
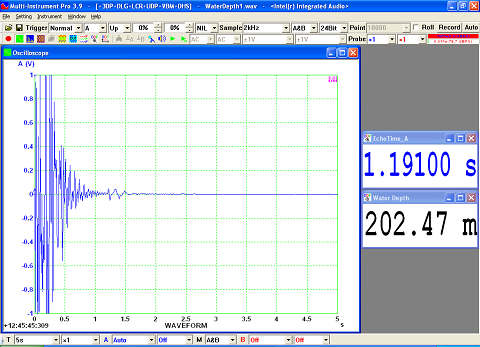
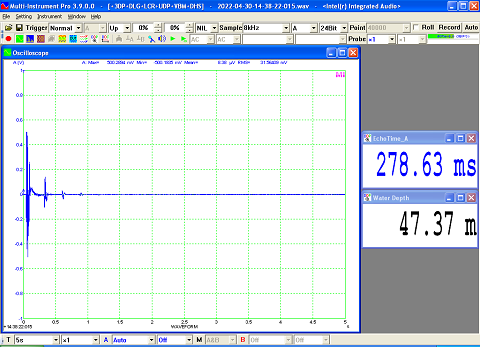
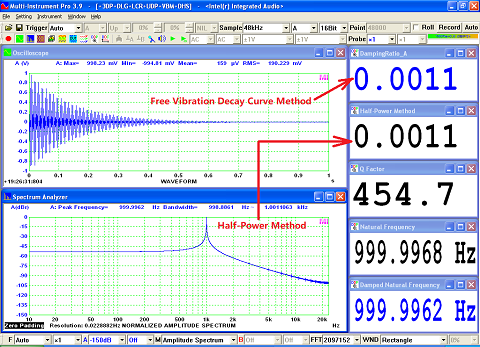
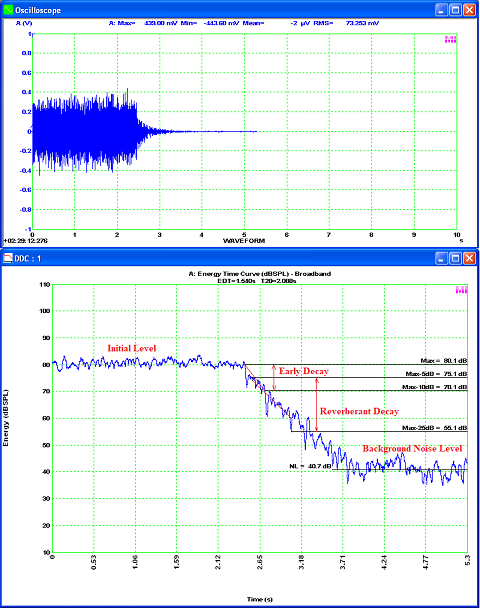
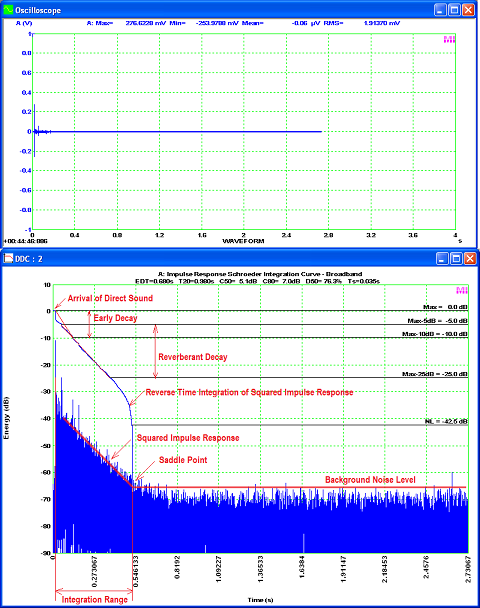
- Support digital filtering (intra-frame processing) such as low pass, high pass, band pass, band stop and arbitrary. The filter class can be FFT, FIR or IIR. Support inter-frame processing including linear and exponential average. Support demodulation (AM, FM, PM), DC removal and rectification. Support removal of time delay between two channels. Support time domain parameter measurements including reverberation and speech intelligibility, waveform discontinuity, step response, echo, and damping ratio.
- Support loading long WAV file frame by frame, either manually or automatically.
- Each frame of data is time stamped with an accuracy of 1ms.
- The data in the graph can be copied into the clipboard as text and later paste into other software such as Microsoft Excel for further analysis. The image of the graph can be copied into the clipboard as Bitmap image and later paste into other software such as Microsoft Word.
- The waveform displayed in the Oscilloscope can be played or cyclically played via the default computer sound card, if the sampling rate and bit resolution of the waveform is compatible with the sound card. Otherwise, it is possible to adjust the replay sampling rate so that the signal is pitch shifted into the audio frequency range.
- The screen display can also work in “Roll” mode.
- Support waveform conversion between acceleration, velocity and displacement. Support both SI and English unit systems.
- Support engineering unit conversion.
- Support auto setting of sampling parameters such as sampling frequency, sweep time and full-scale ADC range. Support Auto Ranging and Auto Scaling.
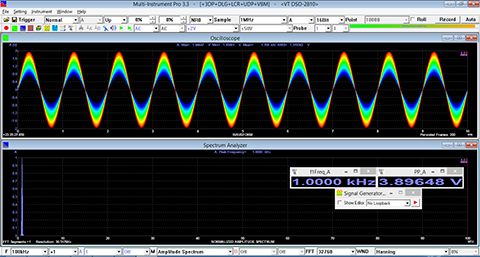
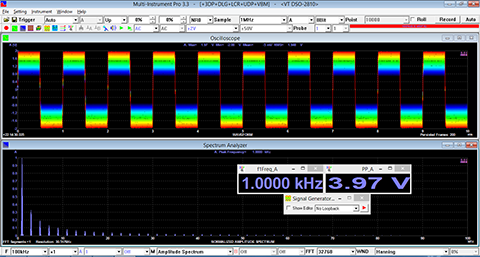
- Support digital persistence (phosphorescent, rainbow) mode and equivalent time sampling mode.
- Support mixed signal (analog and digital) display.
- Supports Multilingual User Interface under Windows 2000, XP, Vista, 7, 8, 8.1, 10, 11 and above. Currently supported languages are English, French, German, Italian, Portuguese, Spanish, Russian, Simplified Chinese, Traditional Chinese, Japanese and Korean.
Examples
×
![]()